如何调试EDN?
本文介绍如何查看Oracle EDN(Event Delivery Network)问题,以及介绍了一些debug EDN 的tools。
调试EDN的工具有:
- Using EDN-DB-LOG
- USing Database Tables
- Sever Logs
(一)使用 EDN-DB-LOG
EDN自带了一个非常有用的EDN DB logging Servlet,用来查看EDN组件产生的logging information。
但这个logging servlet只有当EDN-DB基于AQ时才有,当EDN基于JMS时它并不工作。
这个servlet主要使用SOA_INFRA schema下的表EDN_LOG_MESSAGES。event_queue和oaoo_queue的主要operations都被纪录下来。
默认的URL: http://<host-name>:<port>/soa-infra/events/edn-db-log 。 在这个servlet中可以enable, disable或者clear 这些日志。不过需要administrative role才可以访问这个servlet。
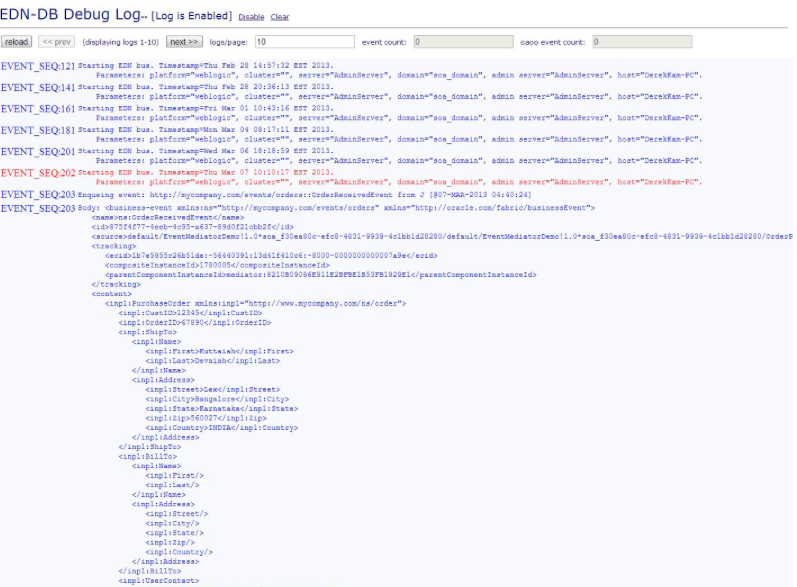
This is a good tool to use to display dynamic counts of un-deq’ed (queued) events (potentially “stuck”) in the “main” and “OAOO” queues. The log also provides information on the EDN bus when it is being connected to AQ-DB. In the screenshot below, “EVENT_SEQ:202” shows that the EDN bus is being started.

当logging被enabled的时候,EDN_LOG_MESSAGES表中将会被塞入message,直到logging被disabled,所以不建议一直开着logging,尤其是有很多events的时候。并建议定期清理logging.
Messages in the log are grouped together. Usually the first line in the group will indicate what operation is being performed, and the event sequence number is used to group the messages together and each group will be highlighted using the same color (e.g. enqueuing an event or handling an event that has been dequeued). In the screenshots below, “EVENT_SEQ:204” is dequeuing an event and “EVENT_SEQ:205” is enqueuing an event.


( 二)使用 Database Tables
第二种方法就是查看数据库表,检查一下可能stuck的events。有下面这些表:
1) EDN_EVENT_QUEUE_TABLE : 这个表给EDN_EVENT_QUEUE AQ使用。每个event都会临时被插入到这个表队列中。
2) EDN_OAOO_DELIVERY_TABLE:这个表只存储OAOO(one-and-only-one) delivery targets相关的events。这些event被临时插入到这个表中。供EDN_OAOO_QUEUE AQ使用。
所以如果是一个OAOO delivery targets相关的events,它讲被存在上面这两张表中。先存放在EDN_EVENT_QUEUE_TABLE,然后存放在EDN_OAOO_DELIVERY_TABLE。

另外还可以查看下面这个视图来看事件的数量。
- AQ$EDN_EVENT_QUEUE_TABLE: There are two rows for every event enqueued into “edn_event_queue”.
- AQ$EDN_OAOO_DELIVERY_TABLE: There is one row for every event enqueued into “edn_oaoo_queue”.

AQ$EDN_EVENT_QUEUE_TABLE这个视图中的MSG_STATE表示该消息的状态。有这些状态。

If the subscriber type is equal to 2 when there is no subscribers to the message, and there is no transaction id due to invalid transaction, it will be marked as UNDELIVERABLE.
When the message state is “Expired”, the AQ$EDN_EVENT_QUEUE_TABLE.EXPIRATION_REASON will be populated with one of the following value:
Messages to be cleaned up later
MAX_RETRY_EXCEEDED
TIME_EXPIRATION
INVALID_TRANSACTION
PROPAGATION_FAILURE
(三)使用 Server Logs
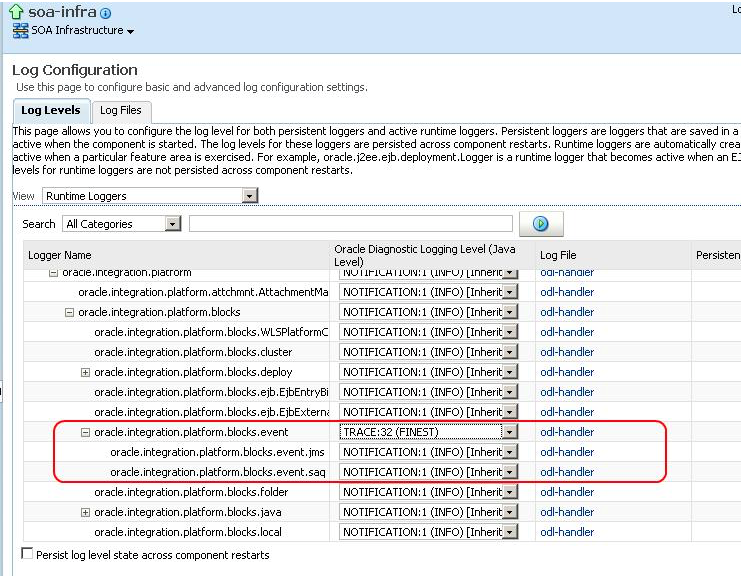
第三种debugging EDN的方法就是查看EM log和log viewer. 这里有些EDN相关的logger names:
- oracle.integration.platform.fa.event.util.PublicEventHandlerExecHelper
- oracle.integration.platform.blocks.event
- oracle.integration.platform.blocks.event.saq
- oracle.integration.platform.blocks.event.jms
我们可以设置log level来捕捉更多的细节:(修改log level立即生效,不需重启server. 不过如果你希望server重启后这些修改还在那里,那么需要check住“Persist Log Level State Across Component Restarts”)
- TRACE:1 (FINE) – Logging the event content details, XPath filter results, event enqueue, dequeue, publish and send operations
- TRACE:16 (FINER) – Logging the begin, commit and rollback statements of XA transaction (for OAOO) and retry count.
- TRACE:32 (FINEST) – All above.

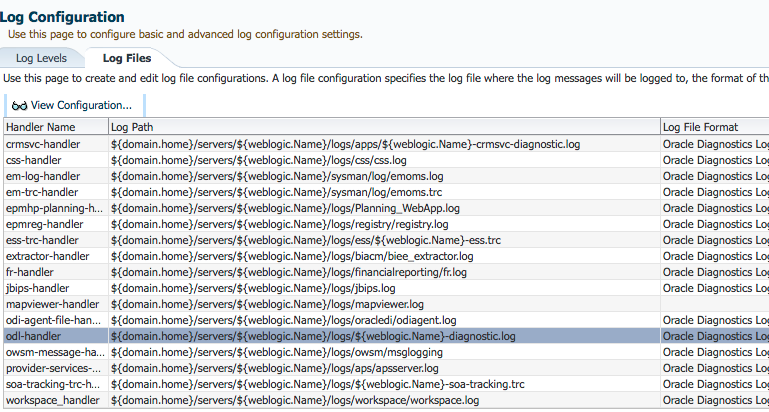
当log level在FINER或FINEST时,我们可以看到一些类似“Began XA for OAOO.” 和 “Rolled back XA for OAOO.”的消息。当没有消息需要等待被delivered的时候,正常就会有这些OAOO event delivery消息,他们并不是error,我们可以将log level设置下调,如FINE。 所有logging 信息都会被写到SOA server的diagnostic.log文件中,这个文件可以在EM的配置中看到。下面是一段delvery到一个OAOO订阅者的分析日志:
[SRC_METHOD: finerBeganXA] Began XA for OAOO.
[SRC_METHOD: fineEventPublished] Received event: Subject: … Sender: …. Event: …
[SRC_METHOD: fineFilterResults] Filter [XPath Filter: …] for subscriber “…” returned true/false
[SRC_METHOD: fineDequeuedEvent] Dequeued event, Subject: … [source type ..]: business-event…
[SRC_METHOD: fineOAOOEnqueuedEvent] Enqueued OAOO event, Subject: … [source: …, target: … ]: business-event…
[SRC_METHOD: fineOAOODequeuedEvent] Dequeued OAOO event, Subject: … [source: …, target: …]: business-event…
[SRC_METHOD: finerInsertedTryCount] Inserted try count for msgId: …. Status: …
[SRC_METHOD: finerRemovedTryCount] Removed try count for msgId: …
[SRC_METHOD: fineSentOAOOEvent] Sent OAOO event [QName: … to target: …]: business-event…
[SRC_METHOD: fineCommittedOAOODelivery] Committed OAOO Delivery, Subject: … [source: …, target: …]: business-event…
[SRC_METHOD: finerBeganXA] Began XA for OAOO.
[SRC_METHOD: finerRolledbackXA] Rolled back XA for OAOO.

(四)总结
有些情况下,可以结合几种方法来调试EDN的问题。下面是Server logging和DB Logging的比较。来帮助我们评估使用哪种方法适合我们要调试的情况。
Server Logging
- EDN will generate standard Java logging messages when events are published, when they are pulled from persistent storage and when they are delivered.
- The logger used by EDN depends on the implementation. For instance, EDN-DB uses “oracle.integration.platform.blocks.event.saq” and EDN-JMS uses “oracle.integration.platform.blocks.event.jms”.
- As in all Java logging, messages are written at different log levels from ERROR to FINEST. The most detailed messages (including the event body) use FINEST.
- Loggers can also be configured in logging.xml in your config directory.
DB Logging
- If you are using EDN-DB, a lot of debugging information may not be accessible due to the many activities that occurred in the database which couldn’t be logged in the server. Hence, a servlet web page that accesses the debug logging table is implemented to assist the debugging process. The page is located at: http://hostname:port/soa-infra/events/edn-db-log and you do need to have administrative role to access the servlet page.
- There are commands on the servlet web page to enable and disable logging and for clearing the log table. The table will be filled with messages, so it is inadvisable to leave logging turned on for large amounts of events. It is recommended to clear the log regularly.
- Messages in the log are grouped together. Usually the first line in the group will indicate what operation is being performed (e.g. enqueuing an event or handling an event that has been dequeued).
参考文档
- https://docs.oracle.com/cd/E29542_01/admin.1111/e10226/appx_trouble.htm#SOAAG97765
- https://docs.oracle.com/cd/E29542_01/admin.1111/e10226/busevent_mang.htm#SOAAG3680
- http://www.ateam-oracle.com/edn-debugging/